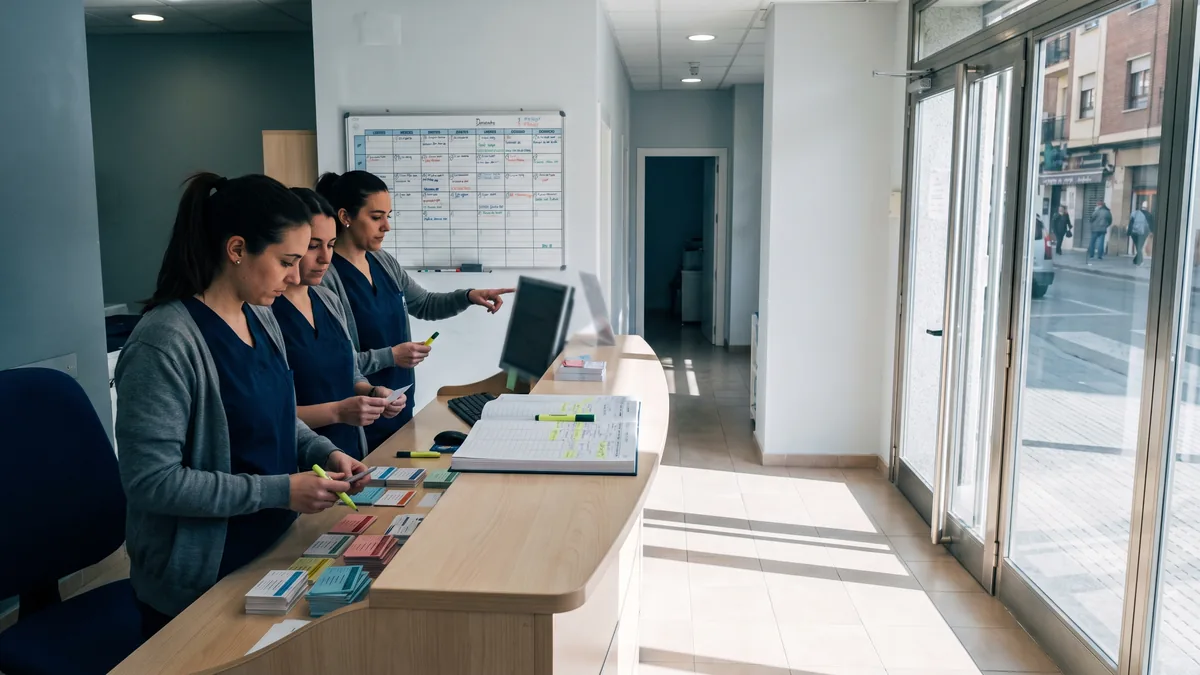
Consultation indicators: occupancy, no-shows, ticket
Measure occupancy, no-show rate and average ticket per patient, and use them in a clinic dashboard to make decisions using data.

Key Takeaways
- Occupancy is only useful if you separate slots offered from slots actually billable and record cancellations and no-shows with a reason.
- The no-show rate falls when it’s measured by practitioner and time slot and when you act with confirmations, deposits and clear rebooking rules.
- Average ticket per patient must be calculated over the same time base and with the same billing rules, otherwise you’ll compare months that aren’t comparable.
- New vs returning patients is the metric that links schedule, cash and acquisition; without that split, the clinic dashboard deceives.
A practice can be “full” and still perform poorly. To decide with less intuition and more control you need three operational indicators: occupancy, no-show rate and average ticket per patient. Here’s how to measure them with the data you already generate in the schedule, front desk and payments.
What “being busy” in a private practice means (and what it doesn’t)
The common mistake is to confuse a “calendar with things written down” with “capacity well used”. Occupancy only makes sense if it defines which slots are put on sale and which end up as attended sessions or, at least, billed.
Define your unit of measure: slot, minute or session
There isn’t a single “correct” way. The right one aligns with how you work and how you charge.
- Schedule slot: useful if your schedule is built in blocks (for example, 30/45/60 minutes) and the front desk thinks in “slots”.
- Minutes offered: useful if each practitioner has variable durations and you want to compare across profiles.
- Sessions performed: useful if your service is very homogeneous and billing is per act.
Action to take (today): decide a unit and write it in an internal “indicator definitions” document. If it varies by specialty, keep two definitions and do not mix them.
Gross occupancy vs net occupancy: separate what’s on sale from what’s real
For management it helps to work with two layers:
- Gross occupancy: offered slots that end up with something scheduled (even if later cancelled).
- Net occupancy: offered slots that end in attended sessions or payment (depending on your rule).
The difference between them tells you how much “noise” there is in the schedule: rebookings, late cancellations, no-shows and dead slots.
Action to take (this week): in the schedule, create clear statuses (for example: confirmed, pending confirmation, cancelled by patient, cancelled by clinic, no-show, rebooked). If your system doesn’t allow that, at least use a notes field with a fixed prefix (P-CAN, C-CLI, NS, REB) so you can count later.
Which slots count as offered
This avoids Monday-morning debates.
Count as offered what was genuinely available to a patient:
- Hours published or communicated to the front desk.
- Open blocks in the schedule (not internal blockings).
- Cover hours opened for substitutions.
Do not count as offered:
- Blocks closed for training, meetings, admin or theatre if they are not sold.
- “Theoretical” slots that nobody can book (for example, because there is no front desk or the phone isn’t answered).
Action to take: check with the front desk for “phantom” slots: they appear on the grid but nobody offers them because “we don’t take first visits then” or “we only give that slot if X calls”. That distorts everything.
Operational reading: occupancy by practitioner, by time band and by visit type
Global occupancy is fine for a slide, but not for running the practice.
Crosses that change decisions:
- By practitioner: identifies whether the issue is demand or supply (hours, schedule, timings).
- By time band: busy mornings and quiet afternoons usually require schedule rules and different messaging.
- By visit type: first visit, follow-up, treatment, technical act, report, etc.
Action to take: every Monday, print or export the previous week and mark three things: the band with the most empty slots, the band with the most cancellations and the visit type with the most rebookings.
No-show rate: measure what doesn’t happen
The no-show rate is the indicator that most disturbs cash and clinical work without appearing in the “number of appointments”. If you don’t measure it with a fixed rule, you’ll end up arguing about impressions: “people are missing more lately.”
Define “no-show” and “late cancellation” (and don’t mix them)
For management it’s useful to separate:
- No-show: the patient does not attend and does not give notice before the threshold you define.
- Late cancellation: notifies, but so late that the slot cannot normally be resold.
- On-time cancellation: allows the slot to be reallocated or sold.
The threshold depends on your operation (session durations, waiting lists, fill capacity). The important thing is that it’s stable and known by the front desk.
Action to take: write a two-line internal rule for the front desk: “If they give sufficient notice, it’s an on-time cancellation. If they give late notice, late cancellation. If they don’t notify, no-show.” Add where it’s recorded.
How to record it to be able to act: reason + channel + band
If you only note “didn’t come”, you’ll learn nothing. On the patient record or the appointment, register three simple fields:
- Reason (short list): forgot, work, illness, transport, childcare, “no answer”, “didn’t confirm”, other.
- Channel: phone, WhatsApp, email, web, referral.
- Band: first hour, mid-morning, midday, early afternoon, late slot.
Don’t seek the “perfect” reason. Seek consistency.
Action to take: for two weeks, require that every no-show has a reason. If missing, log as “no data” and review at daily close.
Segment: first visit is not the same as returning
No-show rates differ significantly between new patients vs returning. If you mix them, you’ll make wrong decisions (for example, toughening rules for everyone when the issue is first visits without a deposit).
- For first visits, the no-show is often linked to lack of commitment or misaligned expectations.
- For returning patients, it’s more often linked to unexpected events and ease of rebooking.
Action to take: calculate the no-show rate for “first visit” vs “follow-up/treatment”. If you can only do it manually, do a one-week sample and repeat monthly.
Actions that reduce no-shows without overloading the front desk
It’s not about “calling more”. It’s about calling smarter and with rules.
- Confirmation with a short script When confirming, don’t ask “Will you come?”. Ask for explicit confirmation and verify details that prevent friction.
Example script:
- “I’m calling to confirm your appointment on [day] at [time] with [practitioner]. Will you keep it?”
- “Perfect. Is this still the same phone and email so we can send a reminder and directions?”
- “If you need to change it, please let us know with enough notice so we can offer the slot.”
- Deposit or upfront payment for sensitive services This is not a moral issue; it’s a scheduling tool. If you apply it, define:
- Which visit types it applies to (for example, long first visit, tests, double sessions).
- How it’s refunded or deducted.
- What happens if the patient rebooks.
Avoid improvisation at the desk: create a standard text.
- Usable waiting list A waiting list without rules doesn’t fill slots. You need:
- Reason for waiting (early, late, any slot).
- Real availability (bands).
- Preferred channel and permission for quick notices.
Action to take: require the front desk to always note, when creating a waiting-list entry, “can attend with X hours’ notice” and “possible bands”. If not present, that entry won’t be usable to fill slots.
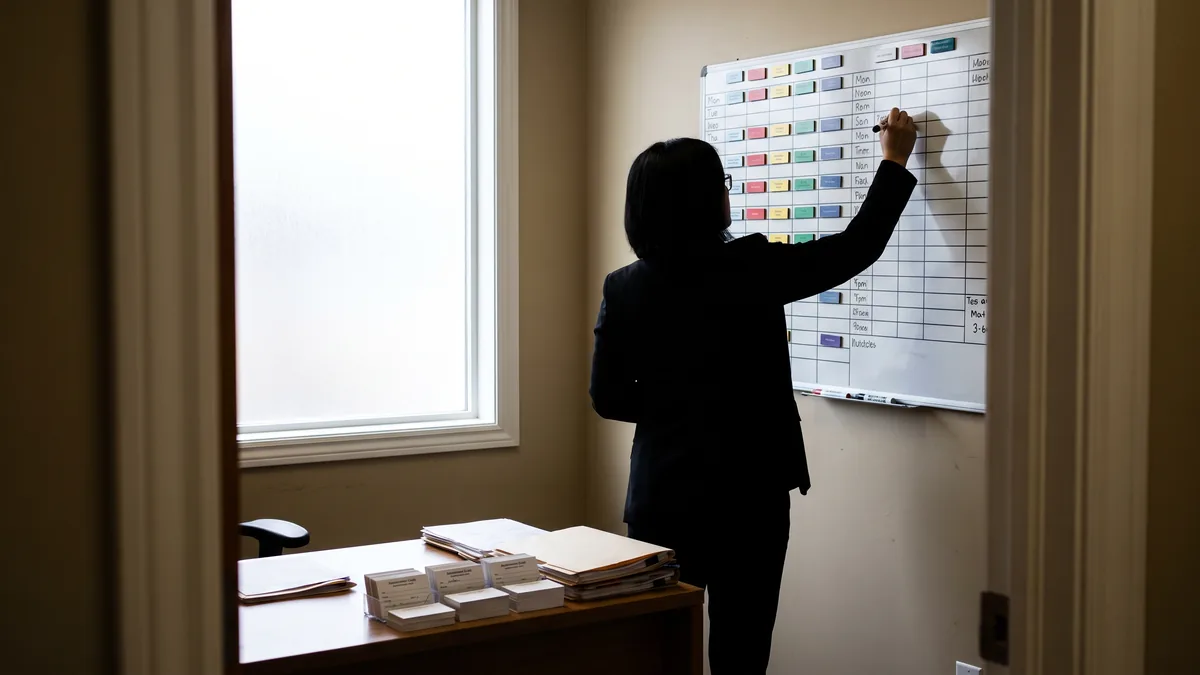
Average ticket per patient: more useful than it seems (if you calculate it right)
The average ticket per patient is not about “charging more”. It’s about understanding which mix of services, follow-ups, treatment packages, reports and acts is supporting revenue, and whether it does so healthily for the schedule.
Decide what’s included in the ticket: billed, collected or both
In clinics with point-of-sale billing, billed and collected often coincide. In others, they don’t.
- Average ticket billed: useful to see generated activity (includes pending items).
- Average ticket collected: useful for cash and treasury (excludes unpaid items and pending).
- Average ticket per visit vs per patient: they are not the same.
If you compare months, keep the same rule. Changing it mid-year breaks the series.
Action to take: write in your clinic dashboard: “Average ticket per patient = total collected in the period / number of unique patients with a collection in the period” (or your definition). The important thing is that it’s fixed.
Unique patient: avoid double counting
If a patient comes three times in the month, do you count them once or three times? For “per patient”, count once. For “per visit”, count three times.
- Per patient: shows the average value of the relationship and service mix.
- Per visit: shows the performance of slots and fees per act.
Action to take: if you can’t get “unique patients” automatically today, do it by exporting payments and deduplicating by DNI/NIE or internal ID. If you don’t have a consistent identifier, create an intake rule to avoid duplicates.
Cross ticket with typology: new vs returning
This cross usually uncovers scheduling decisions.
- If the average ticket per patient among new patients is low and there are many no-shows, you may be booking first visits without filtering motive, duration or expectations.
- If the average ticket among returning patients falls, there may be a continuity issue: follow-ups going to another clinic, treatment packages poorly explained or lack of follow-up reminders (management, not clinical).
Action to take: review 10 patient records of returning patients who have “disappeared” (no future appointment). At the front desk, note the reason if available: voluntary discharge, unreachable, schedule change, price, etc. You don’t need a study; you need a pattern.
Management levers that move the ticket without touching prices
Some levers are purely operational:
- Standardise what is charged and how it’s recorded: avoid cash payments “without concept” or “miscellaneous” without detail.
- Separate clinical acts from administrative tasks: reports, certificates, copies, dealings with insurers, etc., with their own charge if appropriate.
- Reduce billing friction: card terminal ready, payment link if you work with deposits, and a clear invoice policy.
Action to take: review your payment concepts. If there are too many “other” items, you won’t understand the ticket. If there are too many nearly identical concepts, the front desk will choose incorrectly.
How to build a clinic dashboard with these three indicators
A clinic dashboard doesn’t need twenty charts. It needs stable definitions, clear owners and a weekly routine.
Minimum viable indicators (and their slices)
With occupancy, no-show rate and average ticket per patient you already have a core. Add slices so they’re useful:
- Net occupancy: by practitioner and time band.
- No-show rate: by visit type (first vs returning) and by booking channel.
- Average ticket per patient: new vs returning, and by practitioner if relevant.
Action to take: limit the dashboard to one page. If it doesn’t fit, it won’t be reviewed.
Review routine: an operational Monday, not a “numbers meeting”
The review must end with actions in the schedule, front desk or payments.
Suggested routine (30 minutes):
- Front desk brings: list of no-shows with reason and band, and unsold slots by band.
- Management/owner brings: payments by concept and unique patients.
- Team decides: one rule for the week (confirmation, open/close slots, deposit for a visit type, or timing adjustment).
Action to take: finish the review with three assigned tasks, each with “who” and “how it’s checked” (for example, “all long first visits remain in status ‘pending confirmation’ until explicit confirmation”).
Useful questions to ask your software provider
Without expecting specific features, these questions help you know if you’ll be able to measure without wrestling with Excel:
- “Can I export the schedule with appointment statuses and reason for cancellation/no-show?”
- “Can I see unique patients by period and cross them with payments?”
- “Can I reliably separate first visit from returning with a field?”
- “Can I view occupancy by practitioner and time band without complex configuration?”
If you are evaluating tools, ClinicaDigital Software is mentioned here only as a reminder: the criterion is not the brand, it’s whether the data comes out with stable definitions.
Action to take: request a demo focused on your real week: ask them to show how to extract net occupancy, no-show rate and average ticket per patient with your edge cases (treatment packages, insurers, deposits, multiple specialties).
How to Apply This in Your Clinic
Monday, 09:00: set definitions (management + front desk).
Write in a shared sheet: what is an offered slot, what is net occupancy, what counts as a no-show, and how you calculate average ticket per patient.
Check: two different people calculate the same week and get the same result.Monday, 09:30: standardise appointment statuses (schedule owner).
Define 5–7 statuses and a mandatory reason field for late cancellations and no-shows.
Check: by the end of the day, there are no no-shows without a reason or they are marked “no data”.Monday–Friday: capture the data immediately (front desk).
At the close of each appointment: mark final status (attended/cancelled/no-show) and reason if applicable; in payments, register the correct concept.
Check: the daily list of “appointments without final status” is zero before close.Wednesday: review a quick cut by bands (management).
Look at net occupancy and no-shows by band for the week-to-date. Decide a small adjustment: reinforced confirmation in a band or open/close slots.
Check: the change is reflected in Thursday and Friday’s schedule (statuses and rules).Friday: calculate three numbers and a note (management + front desk).
Net occupancy, no-show rate and average ticket per patient; add a contextual note (staff sickness, local holiday, schedule changes).
Check: the following Monday you can compare without arguing “what happened” because the note records it.
Frequently Asked Questions
How do I calculate occupancy if there are internal blockings?
Calculate occupancy over offered slots, not over everything that appears on the calendar. Internal blockings should be excluded from the denominator. If you don’t separate them, it will look like “demand is lacking” when you weren’t offering those slots.
What do I do if my no-show rate is high?
Start by segmenting: first visit vs returning, practitioner and band. Then apply one measure for two weeks only (confirmation with a script, deposit on a visit type or usable waiting list) and re-measure with the same rule.
Is average ticket per patient the same as per visit?
No, they measure different things. Per patient tells you the average value of the relationship in the period; per visit tells you the performance of each slot and fee per act. Choose one as primary and use the other to explain changes.
How do I prevent front-desk data from being incomplete?
Make the data part of the daily close: no appointment is closed without a final status and, where applicable, a reason. Reduce options and use short reason lists so recording is quick. Review a weekly sample and correct with targeted training, not with “we must do better”.
External Links
- BOE-A-2025-390 Resolución de 27 de diciembre de 2024, de la Dirección General de Trabajo, por la que se registra y publica el III Convenio colectivo de Siemens Mobility, SLU. — the BOE (Spain’s official gazette)
- BOE-A-2025-47 Resolución de 20 de diciembre de 2024, de la Dirección General de Trabajo, por la que se registra y publica el XXV Convenio colectivo del sector de la banca.
- BOE-A-2025-20178 Resolución de 25 de septiembre de 2025, de la Dirección General de Trabajo, por la que se registra y publica el Convenio colectivo para sus centros de trabajo de Madrid y Barcelona de IQVIA Information, SA.
- BOE-A-2024-23516 Resolución de 15 de octubre de 2024, de la Dirección General de Trabajo, por la que se registra y publica el Convenio colectivo de T-Systems ITC Iberia, SAU.
- BOE-A-2025-21530 Resolución de 14 de octubre de 2025, de la Dirección General de Trabajo, por la que se registra y publica el XVIII Convenio colectivo nacional de Schweppes, SA.